Reading performance from what a cloud actually reports
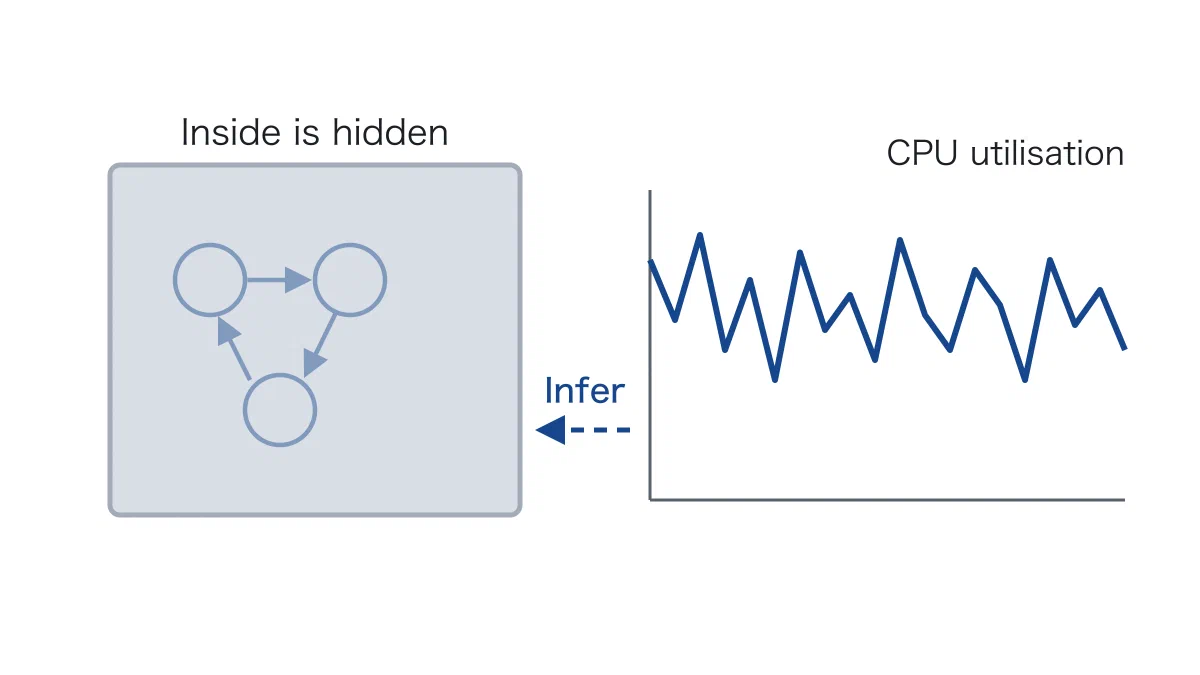
If you want to know how much load a cloud data centre can absorb, detailed information about its internal design is normally out of reach. What you can see is only what is observable from outside, such as CPU utilisation.
This work builds a stochastic model of a data centre from those observations alone and uses it to evaluate performance. In effect, the variation in utilisation is used to infer how work arrives inside and how it is served.
The estimation techniques for Markovian arrival processes and phase-type distributions that we have worked on for years apply here directly. It is an example of machinery developed for software reliability proving equally effective for the performance evaluation of cloud infrastructure.
Source paper
Performance Evaluation of a Cloud Datacenter Using CPU Utilization Data
Mathematics (2023)