When should a product under warranty be inspected?
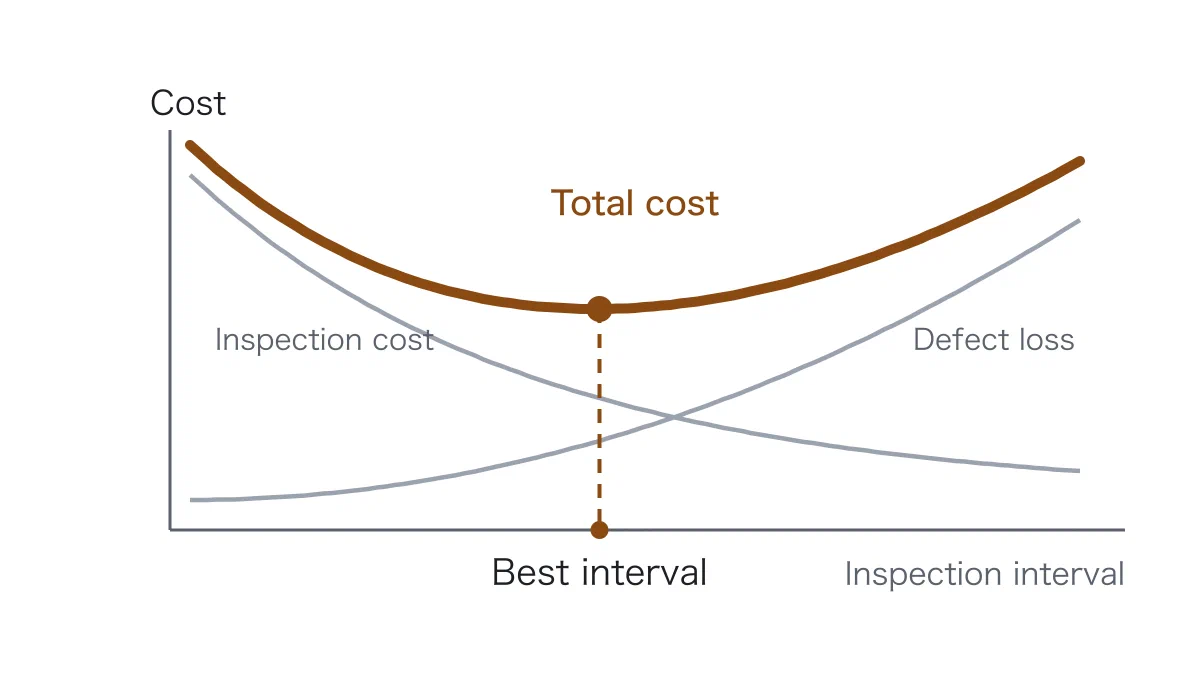
A production line drifts out of adjustment little by little. Left alone it turns out more defective items, but inspecting it means stopping it, and that costs money. If the product carries a free repair warranty, the manufacturer also pays to repair the defective items that reach the market.
This work represents the deterioration of the production process as a stochastic process and derives the inspection schedule that minimises the total of inspection cost, loss from defective items and warranty repair cost. It shows analytically how the terms of the warranty contract shift the optimal inspection interval.
The problem sits between reliability engineering and production management, and the result is widely cited in operations research.
Source paper
Inspection scheduling for imperfect production processes under free repair warranty contract
European Journal of Operational Research (2007)